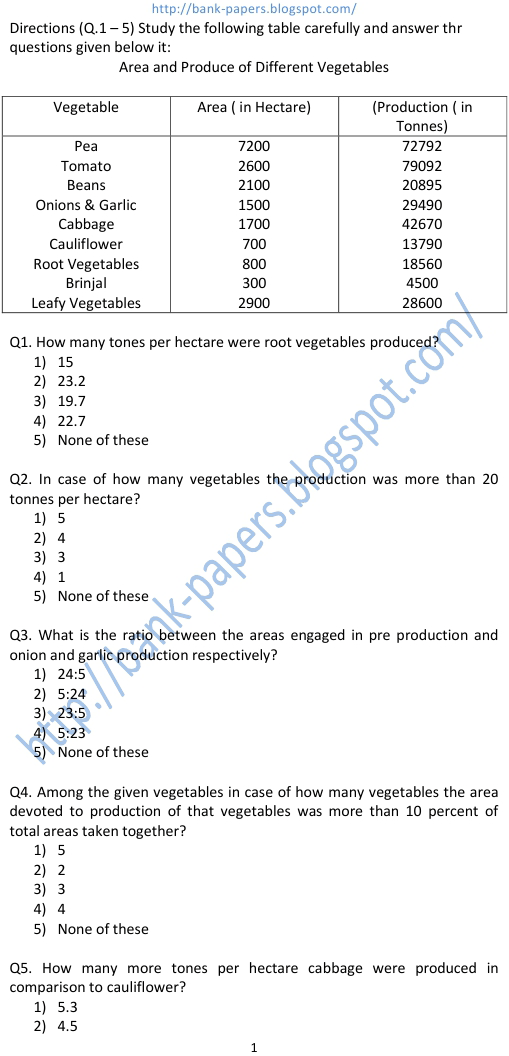
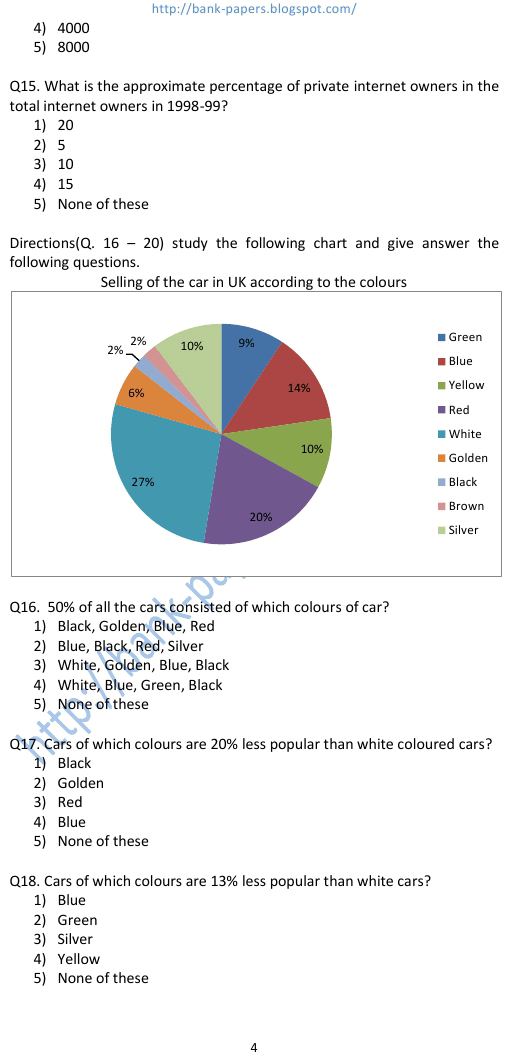
Q1. How many tones per hectare were root vegetables produced? data interpretation questions and answers 1) 15 2) 23.2 3) 19.7 4) 22.7 5) None of these Q2. In case of how many vegetables the production was more than 20 tonnes per hectare? 1) 5 2) 4 3) 3 4) 1 5) None of these Q3. What is the ratio between the areas engaged in pre production and onion and garlic production respectively? 1) 24:5 2) 5:24 3) 23:5 4) 5:23 5) None of these Q4. Among the given vegetables in case of how many vegetables the area devoted to production of that vegetables was more than 10 percent of total areas taken together? 1) 5
Practice Exercise - 86 [ Data Interpretation Questions and Answers ]


data interpretation questions and answers
data interpretation practice problems
data interpretation questions and answers pdf
data interpretation questions with answers
data interpretation tests online
data interpretation practice problems. data interpretation questions and answers pdf. data interpretation pie charts. data interpretation questions with answers. data interpretation and data sufficiency. data interpretation on pie chart. data interpretation tests online. data interpretation online test. questions of data interpretation. pie chart data interpretation. data interpretation & data sufficiency. quantitative data interpretation & data sufficiency. data interpretation practice questions. data interpretation tests. data interpretation practice test. how to solve data interpretation problems. examples of interpretation of data. online data interpretation test.
